
How Microsoft Power Platform is helping to modernize and enable...
In this webinar, our experts showcase a variety of demo use cases of how different components of the...
The purpose of this blog is to show how to quickly debug X++ code using the debugging feature in Microsoft Visual Studio for Dynamics 365 Finance & Operations (D365 FO). More specifically, we’ll be debugging an error message issued from D365 FO.
To accomplish this, we must first understand the logic behind this error message and trace from where in the code it was issued. To debug the X++ code in visual studio with attach to process technique and follow the below steps.
Step 1: Start the Visual Studio as Run as administrator.

In Visual Studio, open the X++ code to be debugged. Find the line or lines where you want execution to stop, and then set breakpoints in those lines. To set a breakpoint in a line, click in the left column of the code editor or press F9 while the cursor is on that line.
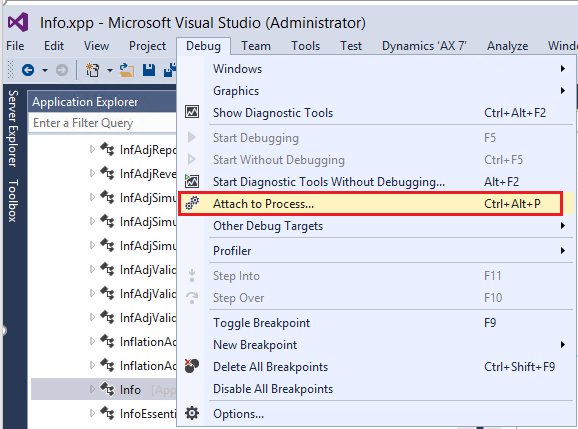
Step 2: Click Debug > Attach to Process.
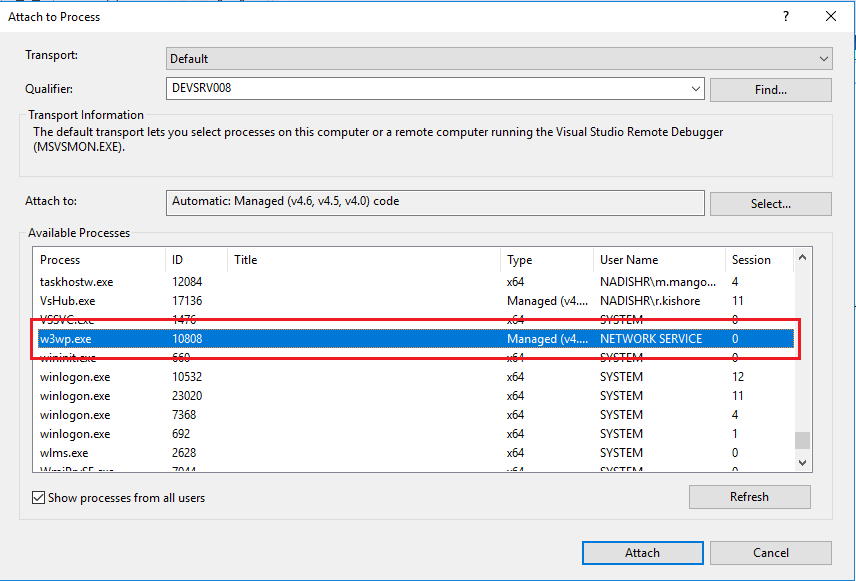
Step 3: On the Attach to Process screen, select the Show processes from all users option, browse to the process w3wp.exe, and click Attach.
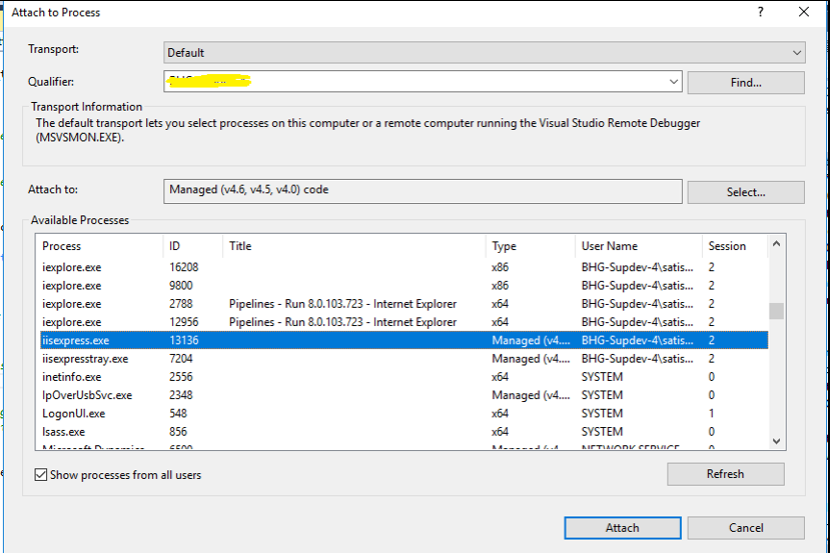
In the latest version (10.0.9), we use iisexpress.exe service to attach the debugger. Once selected, click Attach.
Note: The Show processes for all users checkbox must be check.
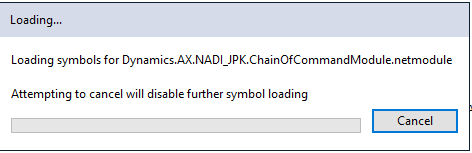
Step 4: Wait until all symbols are loaded and breakpoint dot changed to red color.
Note: If you face any issues (e.g., symbols are not loaded properly), you may need to restart Visual Studio and build your project/solution. Once the symbols have loaded, repeat the application procedure.
Step 5: Now, run your form from front-end and AX will be able to hit the debugger and you will be able to debug the code, which will help to resolve the issue.
Workflow infrastructure in Dynamics 365 uses batch processing, so we need to attach to batch.exe process to debug our workflow code. Use the following steps to debug workflow code:
1. Put breakpoint in one of the following class methods:
2. Click Debug > Attach to Process.

3. On the Attach to Process screen, select the Show processes from all users option, browse to the process Batch.exe, and click Attach.
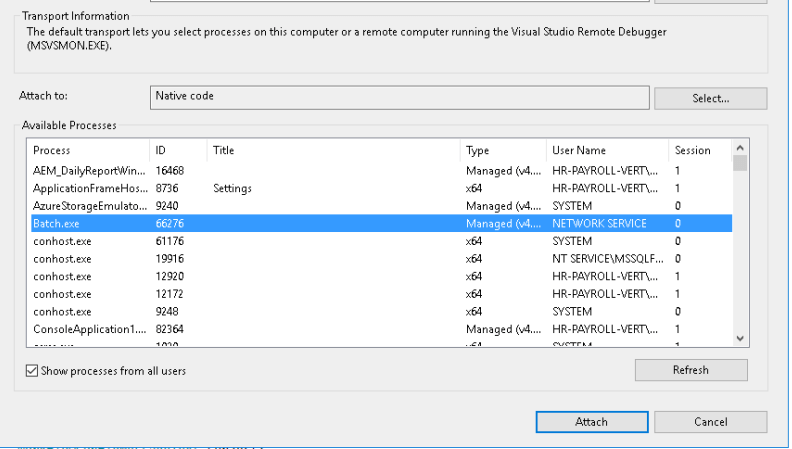
Note: If Batch.exe is not showing, make sure that the service Microsoft Dynamics 365 Unified Operations: Batch Management Service is running.
That’s it! Debugging in a few simple steps. Happy D365’ing!